Canada’s Steep Climb To Meet 2030 Emissions Targets

By Farhad Panahov
Published May 9, 2023 | 6 min read

Scaling down Canada's emissions rapidly to 440 Mt by 2030 will require cuts equal to around four times the drop seen during the pandemic.

Canada’s latest National Inventory Report highlights the progress made on curbing greenhouse gas emissions but also the distance that needs to be covered to reach climate targets.

Canadian GHG emissions stood at 670 million tonnes (Mt) in 2021, a 54-Mt contraction from pre-pandemic levels, but 1.8% above the 2020 lows. Scaling down Canada’s emissions rapidly to 440 Mt by 2030 will require cuts equal to around four times the drop seen during the pandemic. While emissions were 8.5% lower from the 2005 benchmark, achieving the federal government’s target of 40% lower emissions by 2030, as set out in the Emissions Reduction Plan (ERP), would require greater effort.

Canada has set ambitious 2030 emissions target

Combination chart with 2 data series.
GHG emissions, Mt CO2e
Source: Environment and Climate Change Canada, RBC Climate Action Institute 
The chart has 1 X axis displaying categories.
The chart has 1 Y axis displaying values. Data ranges from 439.3314 to 732.219.


Created with Highcharts 11.0.0Emissions2030 target19901995200020052010201520192020202120304005006007008002021​● Emissions: 670​
 
  •  
  •  
 
Canada has set ambitious 2030 emissions target
GHG emissions, Mt CO2e
Source: Environment and Climate Change Canada, RBC Climate Action Institute 
End of interactive chart.

Encouragingly, existing policies have moved the needle: the coal phase-out triggered the largest cuts in the country, while methane reduction policies appear to have a lasting impact, pointing to policy efficacy. Spearheaded by the ERP, further cuts could be driven by recently announced climate policies such as investment tax credits for cleaner fuels, the proposed Clean Electricity Regulations and Oil and Gas Emissions Cap. Carbon pricing remains the cornerstone of the government’s emissions drive, and its continued rollout will be critical to hitting 2030 targets.

Coal phase-out biggest driver of emissions cuts

Line chart with 3 lines.
GHG emissions, Mt CO2e, indexed 2005 = 100 (Shaded areas indicate economic recessions)
Source: Environment and Climate Change Canada, RBC Climate Action Institute
The chart has 1 X axis displaying categories.
The chart has 1 Y axis displaying Values. Data ranges from 0 to 0.


Created with Highcharts 11.0.0ValuesOverallEx. coal used for electricity generation0
 
  •  
  •  
 
Coal phase-out biggest driver of emissions cuts
GHG emissions, Mt CO2e, indexed 2005 = 100 (Shaded areas indicate economic recessions)
Source: Environment and Climate Change Canada, RBC Climate Action Institute
End of interactive chart.

Here’s a look at how some of Canada’s most carbon-intensive sectors are managing their emissions:

Oil & Gas

Oil & Gas 2005-2030 target

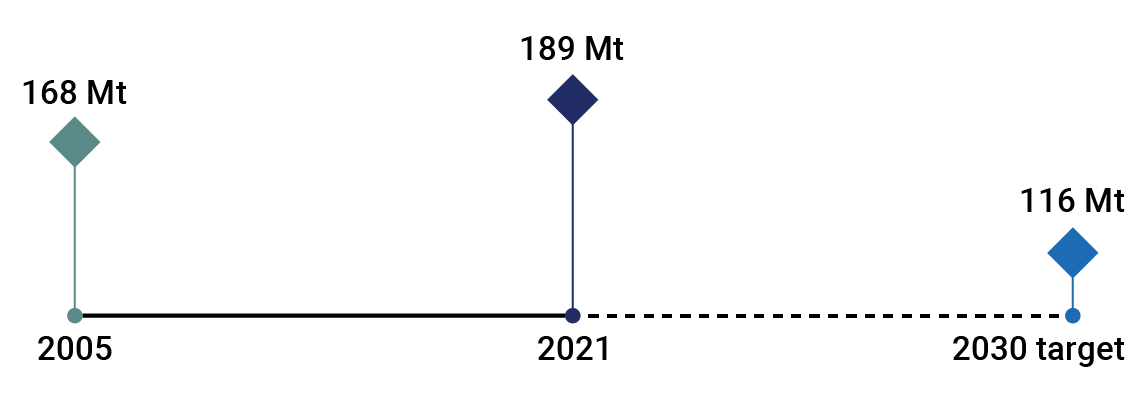
  • Oil & gas is charged with cutting emissions by 73 Mt—the single largest cut in terms of volume among sectors to meet Canada’s 2030 targets.
  • A relatively cheaper fix for methane leaks combined with stringent government policies will help in cutting another 23 Mt.
  • Carbon capture, utilization and storage (CCUS) capacity is projected to reach 30 Mt CO2e per year by 2030, consistent with ERP expectations. If realized, the technology will deliver half the cuts needed to reach the target.
  • New oil and gas related projects valued at $200 billion would require additional heavy investments in abatement technologies such as CCUS to manage emissions.
  • Industry would need to quickly develop and deploy more abatement technologies and identify electrification opportunities across the value chain.

Emissions tracking rising oil production

Line chart with 3 lines.
Index 2005 = 100
Source: Environment and Climate Change Canada, Canada Energy Regulator, RBC Climate Action Institute
The chart has 1 X axis displaying categories.
The chart has 1 Y axis displaying Values. Data ranges from 0 to 0.


Created with Highcharts 11.0.0ValuesOil productionEmission from oil production0
 
  •  
  •  
 
Emissions tracking rising oil production
Index 2005 = 100
Source: Environment and Climate Change Canada, Canada Energy Regulator, RBC Climate Action Institute
End of interactive chart.
Path to 2030: The proposed oil and gas emissions cap policy is designed to slow and limit emissions, while investment tax credits could potentially bolster additional CCUS capacity.

Transportation

Transportation 2005-2030 target

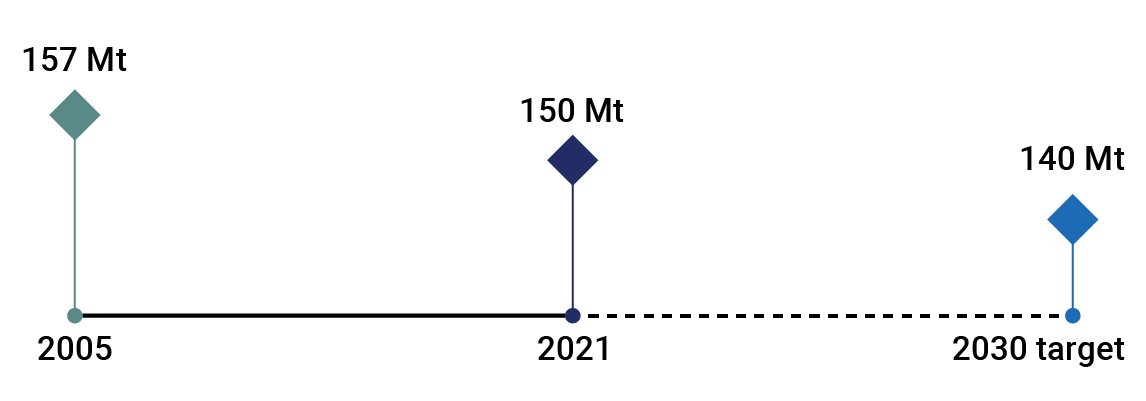
  • Canadian car fleet, accounting for half of transport emissions, grew 30% in past 15 years to reach 24 million. That’s pushed emissions higher despite improved fuel efficiency and exhaust systems.
  • Zero-emission vehicle (ZEV) registration is growing, but at a 1% market share (in 2021), the stock has yet to make a dent in emissions.
  • At current pace, Canada is expected to achieve 40% ZEV sales of the total market by 2030—short of its stated 60% target. ZEVs would make up 17% of the total Canadian car fleet.
  • Pandemic lockdowns saw a 27 MT drop in emissions in 2020, but traffic levels returning to pre-pandemic levels would likely see sector emissions rebound.

Canada fell behind in electrifying cars

Bar chart with 1 bar.
Number of EVs per 100,000 population
Source: BloombergNEF, RBC Climate Action Institute
The chart has 1 X axis displaying categories.
The chart has 1 Y axis displaying Values. Data ranges from 0 to 0.


Created with Highcharts 11.0.0Values0
 
 
Canada fell behind in electrifying cars
Number of EVs per 100,000 population
Source: BloombergNEF, RBC Climate Action Institute
End of interactive chart.
Path to 2030: Auto makers will need to accelerate EV development and offer consumers more choices to comply with ZEV sales target of 60% of total car sales by 2030 and 100% by 2035. Boosting the stock of emissions-free cars could tip the emissions scale later in 2030s.

Electricity

Electricity 2005-2030 target

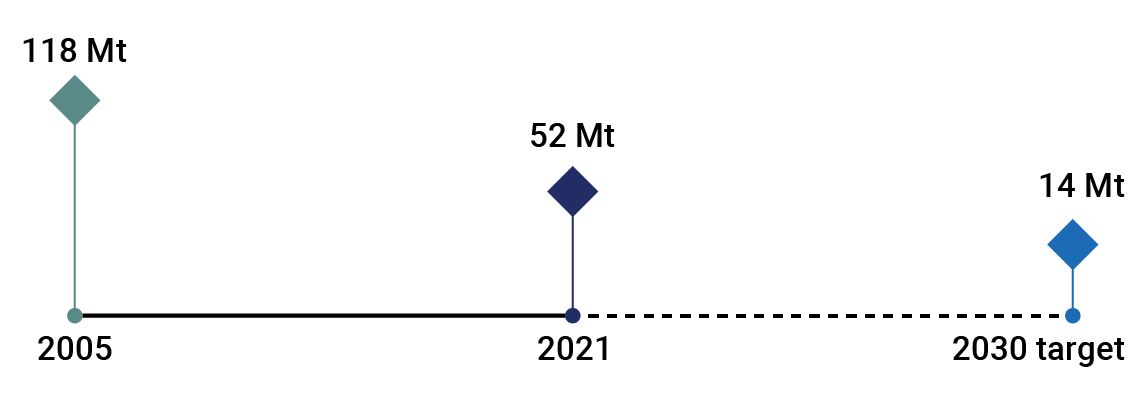
  • A major coal phase-out drove emissions lower in Ontario and Alberta over the past decade. Ontario’s emissions fell rapidly as it expanded its clean energy infrastructure, but maintaining a low-emissions grid is a challenge as its economy and population grows. Meanwhile, Alberta’s electricity emissions declined largely due to a switch from coal to natural gas. Expanding its promising renewables infrastructure will be key in bringing emissions down further.
  • Nationally, continuing coal phase-out will provide just under half of the required 38 Mt reduction (assuming coal-to-natural-gas transition).
  • Additional challenges lie in meeting rapidly increasing electricity demand, grid upgrades, and dependence on stable sources.
  • Meeting new demand entirely with natural gas could potentially push the progress back by 30 Mt.

Combustion remains key electricity source in several provinces

Combination chart with 3 data series.
Thousands of GWh, generated by electric utilities 
Source: Environment and Climate Change Canada, RBC Climate Action Institute | * Preliminary data
The chart has 1 X axis displaying categories.
The chart has 2 Y axes displaying Values and Values.


Created with Highcharts 11.0.0ValuesValuesNatural GasCoalShare of total electricity generation0
 
  •  
  •  
  •  
 
Combustion remains key electricity source in several provinces
Thousands of GWh, generated by electric utilities 
Source: Environment and Climate Change Canada, RBC Climate Action Institute | * Preliminary data
End of interactive chart.
Path to 2030: The proposed Clean Electricity Regulations could facilitate the deployment of cleaner energy sources to curb emissions from rising demand, and lay the foundation of a low-emissions infrastructure to replace retiring plants.

Buildings

Buildings 2005-2030 target

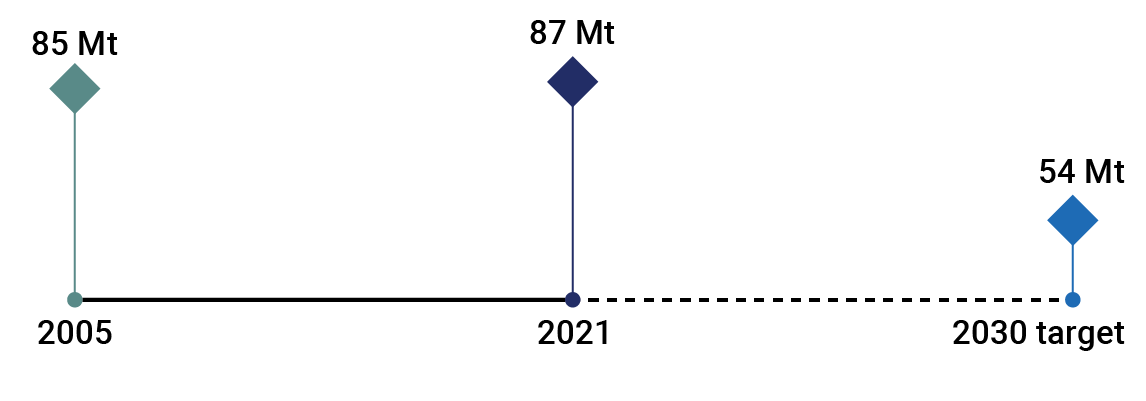
  • Population growth and expanding floor space is driving building emissions faster than energy efficiency can offset. Housing demand is also unlikely to relent any time soon.
  • In half the provinces, the sector is emitting at above 2005 levels. Many regions remain highly reliant on fossil fuels as a heating source and require heavy investments to switch to cleaner fuels.
  • The sector requires a massive 33 Mt reduction to meet 2030 targets, a 39% decline from current levels.

Fossil fuels remain a major heating source

Bar chart with 2 data series.
Residential space heating by fuel,  PJ
Source: Natural Resources Canada, RBC Climate Action Institute
The chart has 1 X axis displaying categories.
The chart has 1 Y axis displaying Values. Data ranges from 0 to 0.


Created with Highcharts 11.0.0Values200520190
 
  •  
  •  
 
Fossil fuels remain a major heating source
Residential space heating by fuel,  PJ
Source: Natural Resources Canada, RBC Climate Action Institute
End of interactive chart.
Path to 2030: Retrofit grant and loan programs have struggled with low pick-up rates. Retrofitting 30% of existing real estate—, an immense challenge and expensive endeavour,—would take us only halfway to our target. Complex set of measures, including but not limited to stronger incentives and stringent regulations, could lead the way past 2030.

Conclusion

Emissions in half the provinces are trending either at above or close to the 2005 stating point, as each region grapples with its own set of unique challenges. Despite higher emissions in carbon-intensive provinces, they will likely see relatively faster cuts in the near term as current policies continue to deliver results, mainly due to methane reduction. Ontario and Quebec made headway in cutting emissions over the past two decades but will enter a slower reduction phase as they tackle the more challenging transport and buildings sectors.

Provincial emissions profiles are vastly diverse

Bar chart with 7 data series.
Share of emissions by sector
Source: Environment and Climate Change Canada, RBC Climate Action Institute
The chart has 1 X axis displaying categories.
The chart has 1 Y axis displaying Values. Data ranges from 0 to 0.


Created with Highcharts 11.0.0ValuesOil and GasElectricityTransportHeavy IndustryBuildingsAgricultureWaste and others0
 
  •  
  •  
  •  
  •  
  •  
  •  
  •  
 
Provincial emissions profiles are vastly diverse
Share of emissions by sector
Source: Environment and Climate Change Canada, RBC Climate Action Institute
End of interactive chart.

A few key measures drove emission cuts over the past two decades, but further reductions will require greater provincial and federal focus—and co-operation. Emissions rising in tandem with an economic recovery could also prove to be a headwind. However, the emerging trend of economic growth decoupling from emissions and Canada’s willingness to implement tough climate policies are grounds for some optimism.


This article is intended as general information only and is not to be relied upon as constituting legal, financial or other professional advice. A professional advisor should be consulted regarding your specific situation. Information presented is believed to be factual and up-to-date but we do not guarantee its accuracy and it should not be regarded as a complete analysis of the subjects discussed. All expressions of opinion reflect the judgment of the authors as of the date of publication and are subject to change. No endorsement of any third parties or their advice, opinions, information, products or services is expressly given or implied by Royal Bank of Canada or any of its affiliates.


Farhad Panahov

Farhad Panahov
Economist


BuildingsCanadaCoalEconomicsElectricityEmissionsEmissions Reduction PlanEnergy Transition MomentumOil & GasTransportation