In this report, our EM FX Strategists discuss the Brazilian Real and extracting information value from the local USD/BRL futures.
Key takeaways
Investors’ FX positioning is usually difficult to measure and existing data tends to have a large lag (CFTC IMM) or only represent a small segment of the market.
Brazil is one of the only markets in EM that provides a good proxy for the overall market participation in FX in the local USD futures market.
Therefore, in this note, we look at whether the positioning in the local USD futures market offers any predictive power for USD/BRL.
We find that it is more useful to look at the net positioning outstanding (stock) rather than relative changes (flow), and specifically the foreign investor positioning.
Additionally, our analysis suggests that one should follow the trend in foreign positioning rather than fade it when positioning reaches “extreme” levels.
FX Positioning
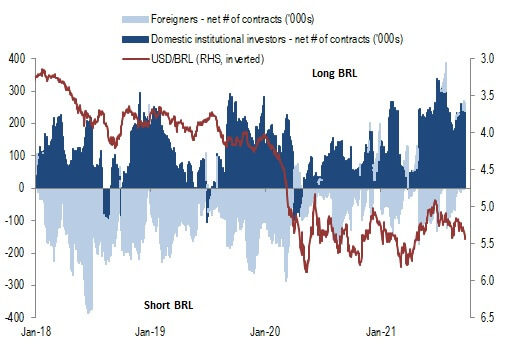
Investors’ positioning in FX is usually difficult to measure and existing data tends to have a large lag (CFTC IMM) or only represent a small segment of the market. Given the local market structure and the non-deliverable nature of BRL, Brazil is one of the only markets in EM that provides a good proxy for the overall market participation in FX in the local USD futures market. Open contracts on the BM&F can also be broken down by all kinds of investor types. In this note, we focus on the net stock of positioning and the flows of local institutional and offshore investors, with the stock defined as the total open contracts on the BM&F and the flow as the relative change in that stock.
Breaking down the local exchange futures positioning data
In order to study the relationship and avoid correlation among factors, we look at the principal components of the relative changes in the net positioning data using:
- the net positioning,
- changes in the foreigners positioning, and
- changes in EM against USD as a control variable (using the FX returns of the GBIEM index).
The analysis results in three principal components, with PC1 and PC2 explaining most of the variance in the relative changes of the net positioning data. The results show that changes in USD/EM (PC2) and the daily local institutional investor flows (PC1) explain only 24% of the variance in USD/BRL, with PC1 explaining just 7%. These results indicate that our intuition of following the relative changes in the open interest of the USD contracts on the BM&F exchange provides little explanatory power about changes in USD/BRL.
Offshore net positioning as a leading indicator for USD/BRL
Given the above result, we also look at the relationship between the net positioning stock of the USD contracts and USD/BRL. What does this tell us about the information contained in the stock positioning data? First, this suggests that it may be more useful to look at the offshore net positioning rather than that of the local institutional investors. Second, the cumulative return using the net positioning of foreigners suggests that one should follow the trend rather than fade the “extreme” positioning.
BRL positioning vs USD on the BM&F exchange

Source: Bloomberg, RBC Capital Markets