
Once again, high-stakes negotiations between the U.S. and Iran deadlocked over Washington's zero uranium enrichment demand, setting the stage for further escalation in the six-week war and prolonged supply disruptions in advance of summer driving season. We have consistently maintained that the chances of a negotiated settlement were exceedingly slim if neither the U.S. nor Iran moved off its entrenched enrichment position. In the absence of a negotiated deal, the White House is essentially left with the option of a strategic retreat that would leave Iran with de facto control over the Strait or a military escalation aimed at eliminating the Tehran tollbooth.
By announcing an impending blockade of the Strait, President Trump may be signaling that he is not prepared to cut his losses just yet. In pursuing this strategy, President Trump may be calculating that China will become more active in negotiations if it faces a cutoff of Iranian cargoes to its refineries. However, it's unclear how deeply China wants to wade into the war at this stage, given that it built up large strategic energy reserves in advance of the conflict and may be realizing some strategic gains by having the U.S. redirect military assets away from Asia towards the Middle East. Also, it may prove to be a far more challenging undertaking to blockade Iran than Venezuela, and we would anticipate Tehran will increase attacks on regional energy facilities, including critical derisking infrastructure, if President Trump backs his threat with action.
"In the absence of a negotiated deal, the White House is essentially left with the option of a strategic retreat that would leave Iran with de facto control over the Strait or a military escalation aimed at eliminating the Tehran tollbooth."
- Helima Croft, Head of Global Commodity Strategy and MENA Research, RBC Capital Markets
While market participants continue to watch for a greater Houthi entrance into the conflict, the Iranian-backed militias in Iraq are an underappreciated risk, especially given their apparent role in last week's attacks on Kuwaiti and Saudi infrastructure, including the East-West pipeline. It will be key to watch whether the breakdown in talks and announcement of the blockade will materially move market sentiment. Since the start of the war, we have maintained that conflict duration would ultimately determine price trajectory. However, given President Trump's proactive effort to manage timeline sentiment, there remains a significant segment of the market that reacts far more to social media messages than the absence of molecules moving through the Strait of Hormuz.
Given the scale of the actual supply losses, White House message management has been far more effective in establishing a flat price ceiling than we anticipated at the outset of the war. That said, the physical market warning signs continue to flash red, with differentials broadly strengthening further last week as physical market participants fail to envision near-term relief for ongoing tightness. Moreover, if President Trump does indeed back his blockade threat with actual boats, a convergence between the paper and physical markets may soon come.
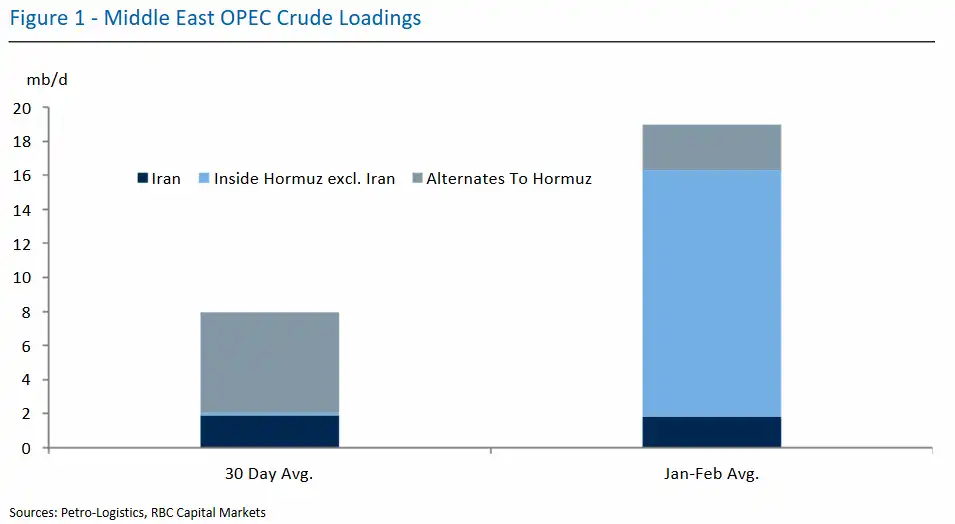
Figure 1 titled "Middle East OPEC Crude Loadings" is a stacked bar chart displaying crude oil loading volumes measured in million barrels per day (mb/d) across two time periods. This chart uses three color-coded categories: Iran (dark blue), Inside Hormuz excl. Iran (light blue), and Alternates To Hormuz (gray-teal).
The left bar represents the 30 Day Average with a total of approximately 8 mb/d, comprised of approximately 2 mb/d from Iran, minimal to no volume from Inside Hormuz excluding Iran, and approximately 6 mb/d from Alternates To Hormuz.
The right bar represents the January-February Average with a total of approximately 19 mb/d, showing a dramatic increase. This bar consists of approximately 2 mb/d from Iran (unchanged from the 30-day average), approximately 14 mb/d from Inside Hormuz excluding Iran (representing the bulk of the increase), and approximately 3 mb/d from Alternates To Hormuz.
The chart demonstrates that while Iranian crude loadings remained relatively stable at around 2 mb/d, there was a substantial increase in non-Iranian crude loadings through the Strait of Hormuz, rising from near zero to approximately 14 mb/d in the January-February period. Alternative routes to Hormuz decreased from approximately 6 mb/d to 3 mb/d. Overall, total loadings more than doubled between the two periods. Sources: Petro-Logistics, RBC Capital Markets.
Helima Croft authored "Iran Quick Take: Blockade Brinkmanship," published on April 12, 2026. For more information on the full report, please contact your RBC representative.
