Featured insights
More insights and analysis
We haven't seen downside risk from headlines captured in options yet, says RBC's Amy Wu Silverman
Published September 2, 2026
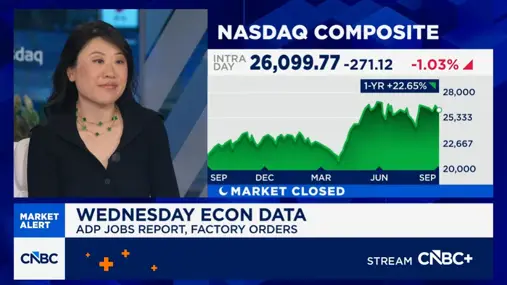
Amy Wu Silverman, RBC Capital Markets head of derivatives strategy, joins 'Squawk Box' to discuss the latest market trends, what options say about equities, what to make of seasonal volatility, and more.
Watch the full segment – "We haven't seen downside risk from headlines captured in options yet, says RBC's Amy Wu Silverman"
What's ahead for interest rates? Talking with RBC Rate Strategist Blake Gwinn
Published September 1, 2026
Barron's Senior Managing Editor Lauren R. Rublin and Senior Markets Analysis Writer Paul R. La Monica speak with Blake Gwinn, head of US Rates Strategy at RBC Capital Markets, about the outlook for financial markets, industry sectors, and individual stocks.
Listen to the full episode — "What's ahead for interest rates? Talking with RBC Rate Strategist Blake Gwinn"
Midterms on our mind
Published August 20, 2026
The big things you need to know:
- First, we took a look back at equity market and sector performance in 2H18 and 2H22, around the last two midterm elections. Conditions were choppy with two distinct drawdowns interrupted by a meaningful rally. Consumer Staples and Health Care outperformed during the drawdowns while Financials, Industrials, and Materials outperformed in the rebounds.
- Second, other things that jump out in our updates this week include shifts we’re seeing in our factor work, descriptions of a cautious consumer in our earnings call transcript analysis, the tendency of the stock market to perform well when IPO activity is ramping up, and what we see as reasonable valuations across the major indices in the US.
Listen to the full episode — "Midterms on our mind"
Go deeper
In-depth analysis and expert perspectives on the macro trends shaping economies and markets.