OPEC+ announced a 188 kb/d production increase on Sunday against a backdrop of continued uncertainty about the trajectory of Hormuz transits as well as the diplomatic path to converting the Memorandum of Understanding to a final deal by mid-August.
Iraqi officials have issued somewhat contradictory statements, with some calling for greater production autonomy, which was interpreted as a veiled threat to leave the producer group.
Hormuz transits remain 71% below pre-war levels, with Western and Japanese shippers hesitant to resume operations until a final agreement moves beyond the mid-August MoU target date.
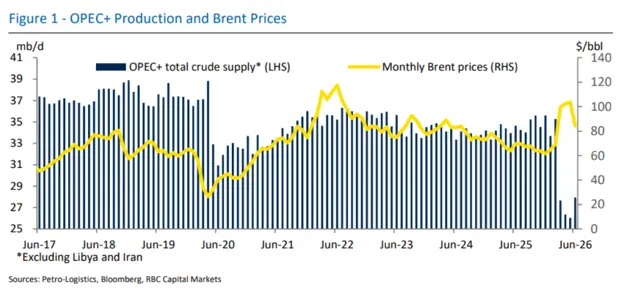
The left vertical axis measures OPEC+ total crude supply in million barrels per day (mb/d), scaled from approximately 25 to 41 mb/d and represented by dark navy blue vertical bars; a footnote clarifies that this supply figure excludes Libya and Iran.
The right vertical axis measures monthly Brent crude oil prices in dollars per barrel ($/bbl), scaled from 0 to approximately $140/bbl and represented by a gold line.
From June 2017 through mid-2019, OPEC+ supply remained elevated in the 36–38 mb/d range while Brent prices fluctuated between roughly $55 and $85/bbl. A pronounced supply contraction is visible around June 2020, consistent with COVID-19-related production cuts, with supply declining to approximately 29–31 mb/d; Brent prices also fell sharply to approximately $40/bbl at that point before recovering.
Supply gradually increased through 2021 and into 2022 as production quotas were progressively eased. Brent prices surged to their highest level on the chart — approximately $120/bbl — around June 2022, before declining steadily through 2023–2025 into the $70–85/bbl range.
At the far right of the chart, in June 2026, OPEC+ supply registers the most pronounced single-period decline in the entire dataset, falling to approximately 26 mb/d — the lowest supply level recorded — while Brent prices simultaneously recovered to approximately $100/bbl, indicating that a significant production curtailment is supporting renewed price strength.