The nine-month Iran conflict has increasingly become a split screen war, with market observers and security experts reaching starkly different conclusions about the trajectory and duration of the conflict. One set of market participants focuses singularly on exports moving through Hormuz, assuming most disruption is in the rear-view mirror. Meanwhile, an increasing number of security experts in Washington and the region are alarmed by Iran's willingness to pursue an escalation strategy designed to break the economic siege and reduce the American footprint in the Middle East.
The 2027 glut thesis rests partly on the assumption that current Hormuz transit patterns will persist despite ever-more-deadly maritime attacks, or that Washington and Tehran are approaching a diplomatic deal enabling a return to pre-February conditions. Since the war began, deal headlines have helped contain prices against a backdrop of drone, missile, and mine attacks. White House messaging about resolution coming "soon" has also reinforced short-duration expectations among market participants.
"The history of armed conflicts in the post-WWII period shows that short wars are actually something of an anomaly, not the norm."
Helima Croft, Head of Global Commodity Strategy and MENA Research, RBC Capital Markets
Yet the history of armed conflicts in the post-WWII period shows that short wars are actually something of an anomaly, not the norm, with the average interstate conflict lasting 2.1 years and the average intrastate conflict lasting 3.5 years. The June 2025 12-day war between U.S./Israel and Iran is therefore a notable outlier, even as it has served as a key reference point driving recency bias in the market.
The ability of the U.S. to deploy enormous military resources to assist with cargo evacuation through Hormuz has been cited as evidence of the market's invisible hand finding a workaround. A recurrent theme in Washington conversations is that rising transits have come at enormous cost not only to the U.S. Treasury but also to U.S. force readiness. A clear consensus from these discussions is that Iran shows no signs of dropping its maximalist demands for full enforcement of the June MoU despite the blockade's mounting economic cost. Iran has been one of the most sanctioned countries on earth since the 1979 revolution, and its leadership has developed a resistance-economy playbook, even at the cost of enormous civilian suffering.
Even the leading proponents of the "let-the-blockade-do-the-work" strategy in Washington and the region concede that it will require a significant amount of time to achieve its stated objectives, with estimates ranging from 8-9 additional months to as far out as two years. All the while, Tehran is expected to continue its steady escalation of strikes on Hormuz tankers and U.S. military assets, with Kuwait and Bahrain bearing the brunt of recent Iranian fire. If Iran continues to move the conflict up the escalation ladder, regional energy facilities could also come under increasing fire to raise the stakes for blockade supporters.
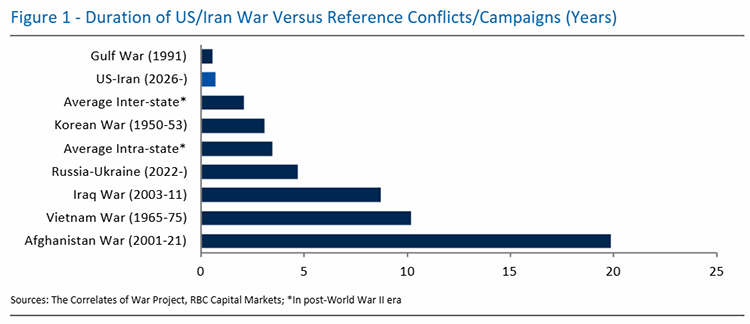
A horizontal bar chart titled "Figure 1 - Duration of US/Iran War Versus Reference Conflicts/Campaigns (Years)" displays the duration in years of nine conflicts, measured along an x-axis ranging from 0 to 25 years in intervals of five. Reading from top to bottom, the conflicts and their approximate durations are: Gulf War (1991) at 0.6 years; US-Iran (2026-) at 0.75 years, rendered in a bright royal blue bar to distinguish it as the focal data point; Average Inter-state at 2.1 years (denoted with an asterisk as post-World War II); Korean War (1950-53) at 3.1 years; Average Intra-state at 3.5 years (also asterisked); Russia-Ukraine (2022-) at 4.7 years; Iraq War (2003-11) at 8.8 years; Vietnam War (1965-75) at 10.2 years; and Afghanistan War (2001-21) at 20.0 years. All reference bars appear in dark navy, while the highlighted US-Iran (2026-) bar appears in bright royal blue. The chart features a medium-blue title, thin dark grey horizontal dividing lines framing the chart area top and bottom, and a white background. A footnote at the bottom-left reads: "Sources: The Correlates of War Project, RBC Capital Markets; *In post-World War II era."
The Houthi entry into the conflict has provided Tehran with an invaluable assist. Not only has Houthi action inflicted damage on Saudi infrastructure, but it has also signaled the limits of U.S. security guarantees to Gulf allies, with Washington resisting direct participation in operations against the Yemen-based fighters.
A key question is how long Iran can continue this pattern of escalation without a more forceful response from Washington. Exit-strategy scenarios being discussed in Washington contain a final salvo dynamic, including a potential U.S. strike on Iran's fortified Pickaxe Mountain nuclear facility. The U.S. would likely need to use a MOAB ordnance or weapon not previously deployed on the battlefield to disable the mountain-embedded site. This carries the risk of a correspondingly extreme retaliatory response and/or more determined Iranian resolve to impose its terms on the region following an American exit. Whether elevated exports could be maintained in a hasty American withdrawal scenario is highly questionable, especially if concurrent with removal of U.S. military assets aiding transits and absent a maritime management agreement among key regional players.
Neither the current unstable stalemate nor an escalation-to-exit scenario appears to provide a beneficial backdrop for elevated exports or production over the next 6-9 months. A peace deal would indeed be a game changer, but all signs indicate that such an offramp will likely continue to prove elusive during this period.
Helima Croft authored "Postcard from DC: Split Screen War," published on November 18, 2026. For more information on the full report, please contact your RBC representative.
